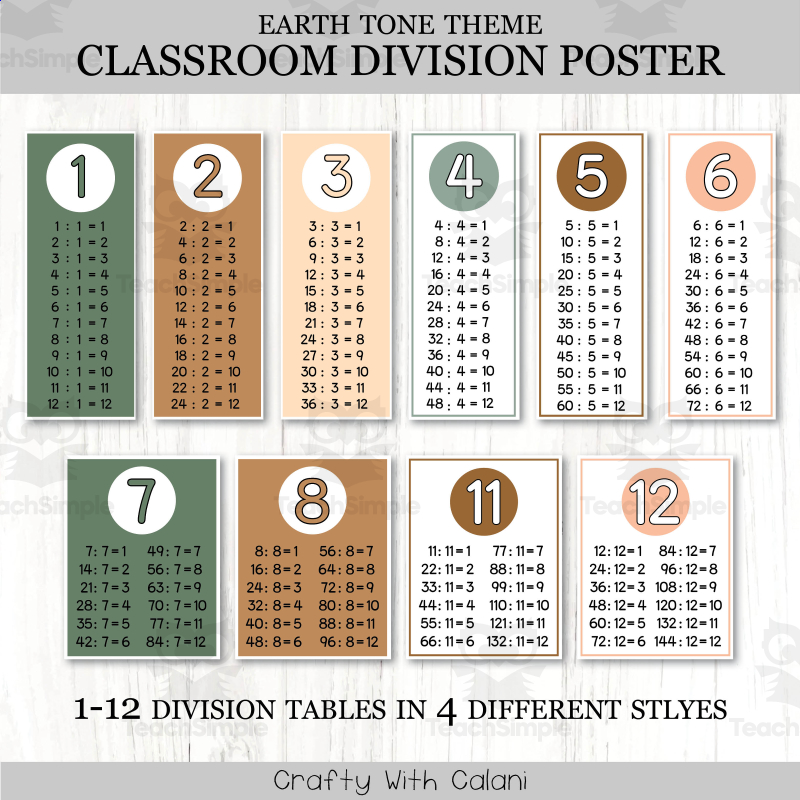
Classroom Division Facts Posters, Math Decor in Earth Tone Design
A set of classroom wall posters/charts displaying division facts from 1 to 12, used as visual reference decor to support memorization of division facts.


159 resources
Explore sub-categories
8 sub-categories · 159 resources
A set of classroom wall posters/charts displaying division facts from 1 to 12, used as visual reference decor to support memorization of division facts.

A five-step statistics project has students design their own survey question with six to eight numerical answer choices, then survey at least twenty people and tally the responses. Students convert their collected data into both a dot plot and a histogram, labeling the x- and y-axis and adding a title to each chart. Blank axis templates for both charts are printed directly on the page, with a printed frequency scale from 1 to 11; larger frequencies may need an adapted scale or extra graph paper. A closing reflection section asks students to compare the two chart types and describe what surprised them in their own data, followed by a five-point self-assessment rubric covering four of the project's skills.
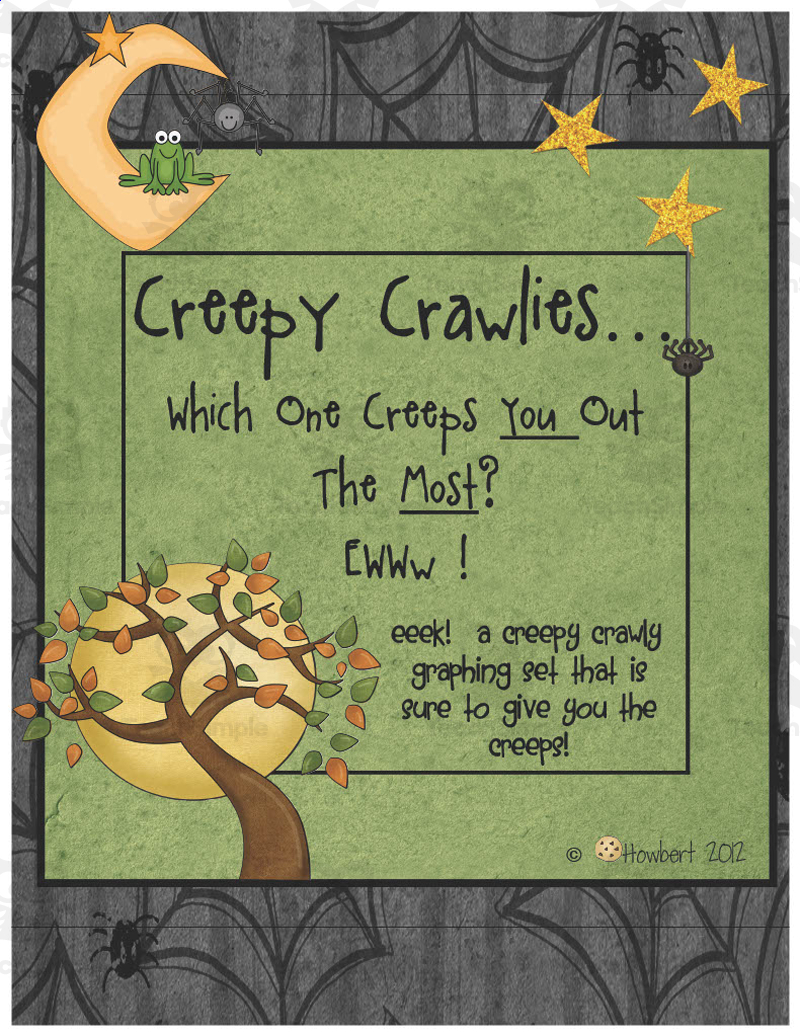
This resource is a Creepy Crawlies Interactive Graphing Set. You will receive: • Tips for the Teacher • Creepy Crawly Posters & Decorations • Kids’ Full moon Graphing Pics for Big Graph Chart • Creepy Crawly Tally & Bar Graphs, counting by…
Data Analysis & Probability: Tally Charts - Learn the Skill on FLASH-MAC As an indispensable tool for educators, 'Data Analysis & Probability: Tally Charts - Learn the Skill' offered by FLASH-MAC simplifies teaching critical math…
FLASH-MAC: A Comprehensive Teaching Resource Data Analysis & Probability: Tally Charts - Pre- Assessment & Teach the Skill is a comprehensive teaching resource designed primarily for Grade 1 and Grade 2 students.
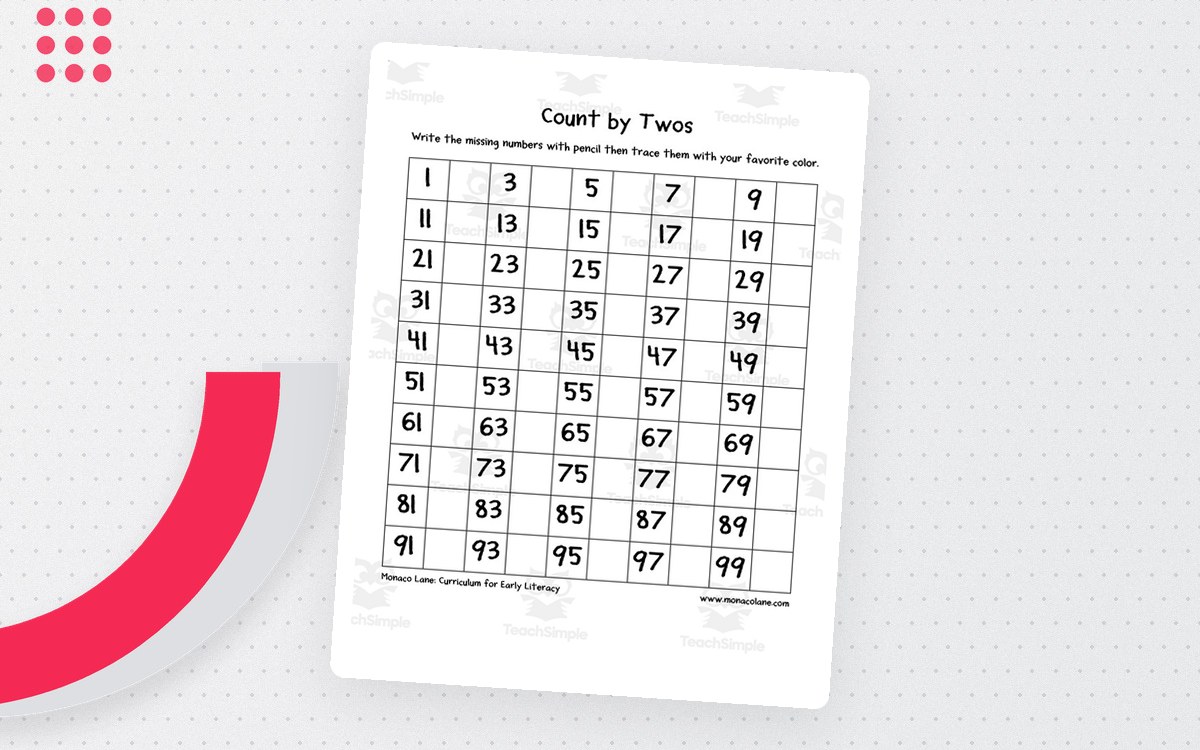
This resource is a set of Fill-in Skip Counting Charts . There is a chart for skip counting from 2's to 12's. Students will write the missing numbers with pencil then trace them with their favorite color.
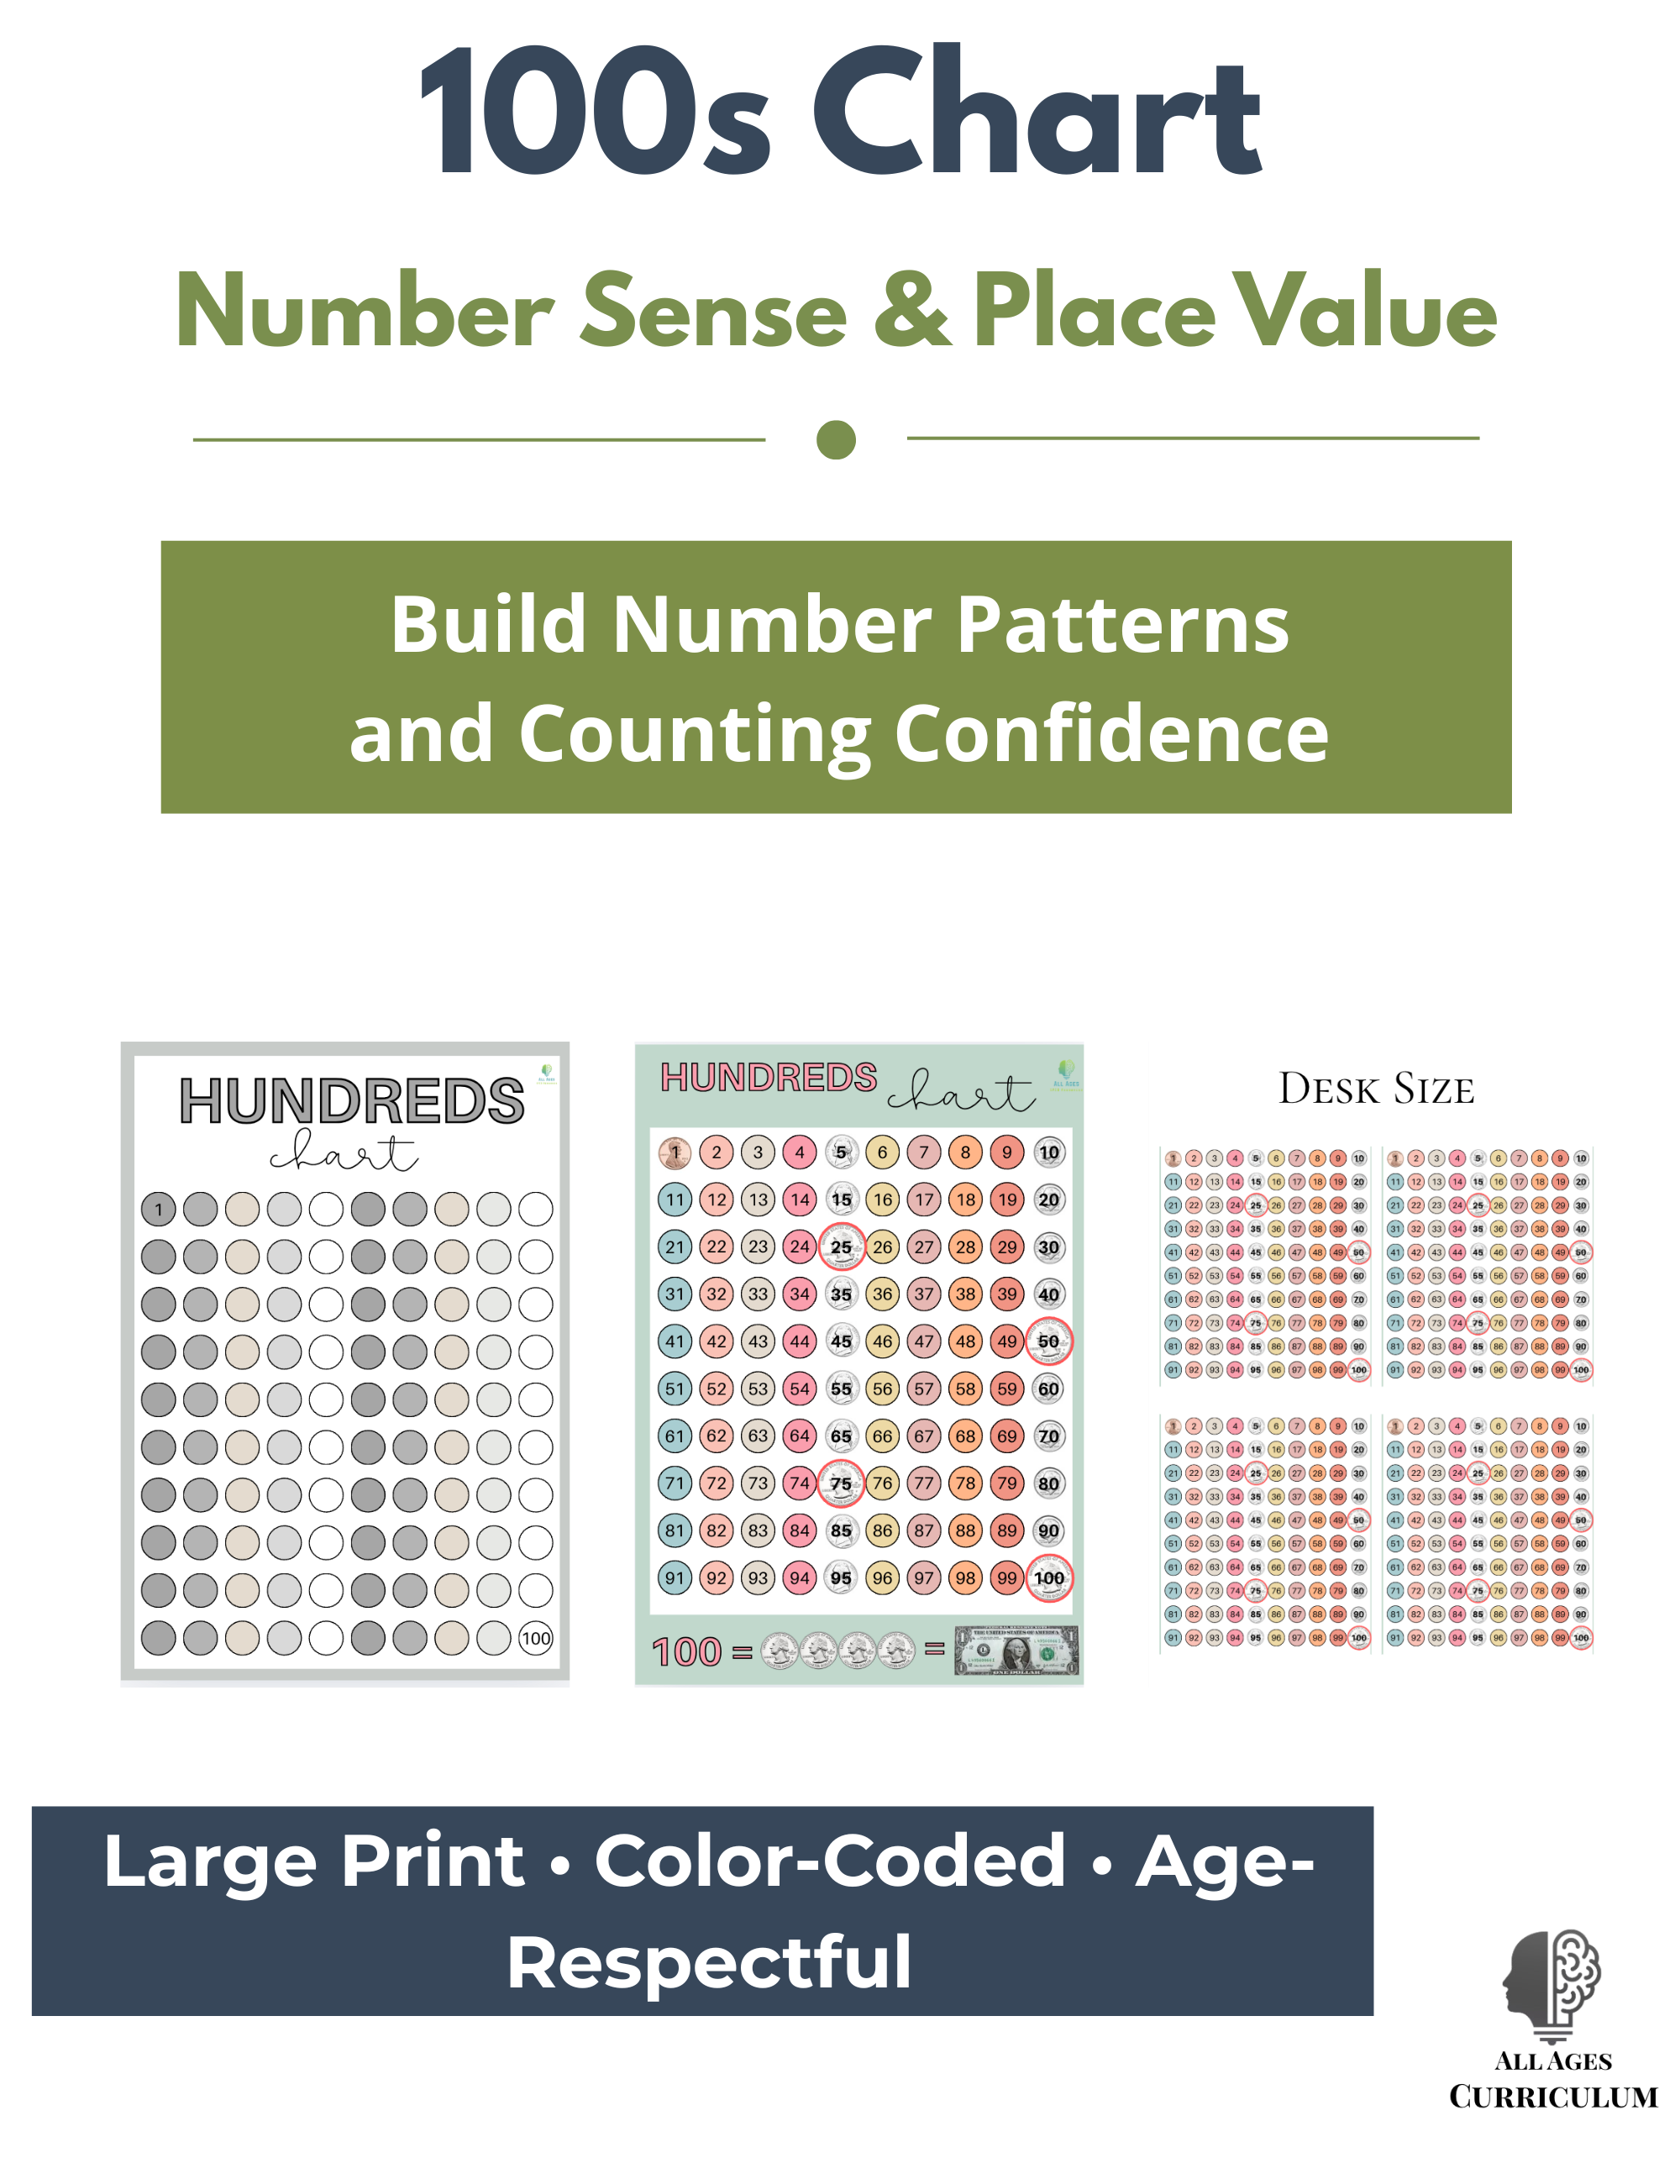
A large-print hundreds chart resource for building number sense, place value, and counting skills, marketed specifically for older struggling learners (rather than typical primary-grade charts).

A printable anchor chart set introducing basic fraction vocabulary and concepts (equal parts, numerator, denominator, part of a set/whole, unit fraction names) for classroom wall display.

This Pie Graphing Pies Worksheet is a great way for students to learn how to create and interpret pie charts . This activity will help students understand data and sales percentages.
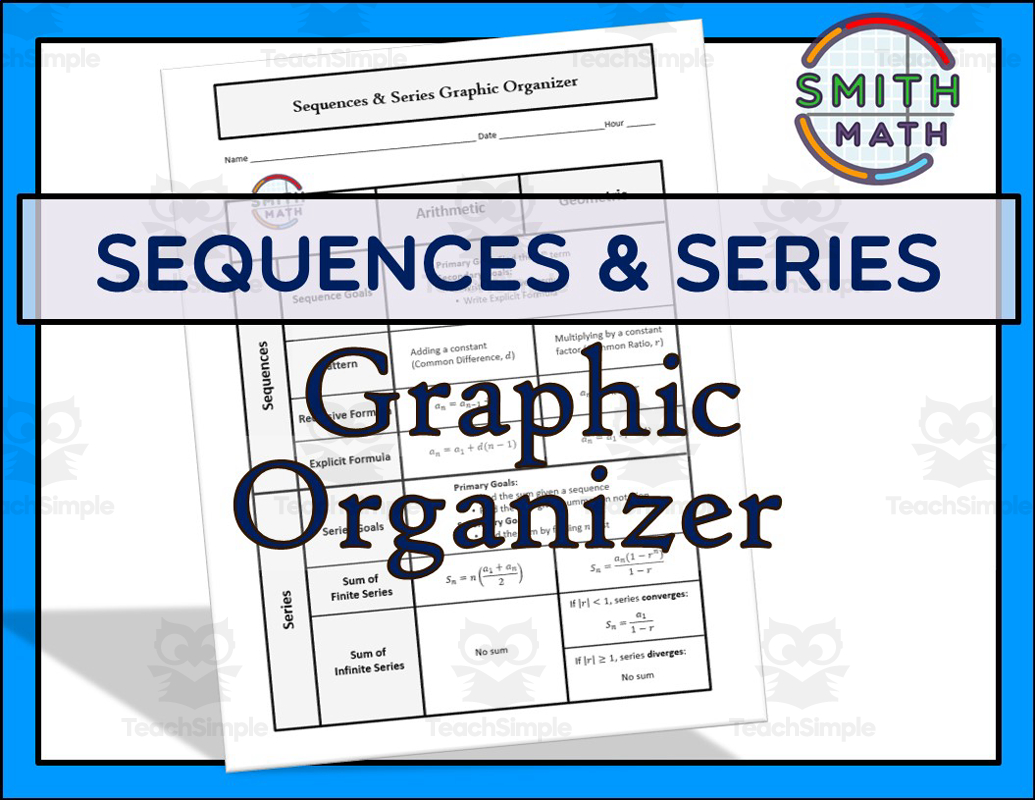
If you are a high school math teacher, finding resources that best serve for your students is of the utmost importance! This is a Sequences and Series Graphic Organizer that is filled with purposeful information that your students can put…

Title: Tooth Graph and Class Birthday Chart Welcome to the Tooth Graph and Class Birthday Chart! This unique, easy-to-use teaching resource is designed to create a visually appealing and interactive learning environment.
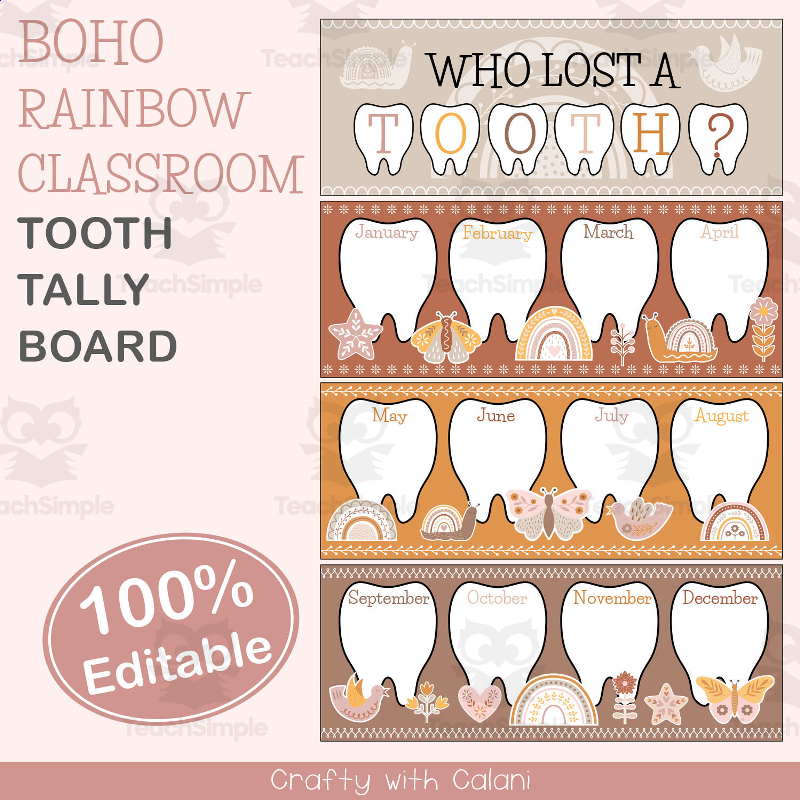
Editable classroom tooth-loss tally chart/poster (Boho Rainbow theme) for tracking and graphing which month students lose teeth, used as a classroom-management and math data activity.
 Free download
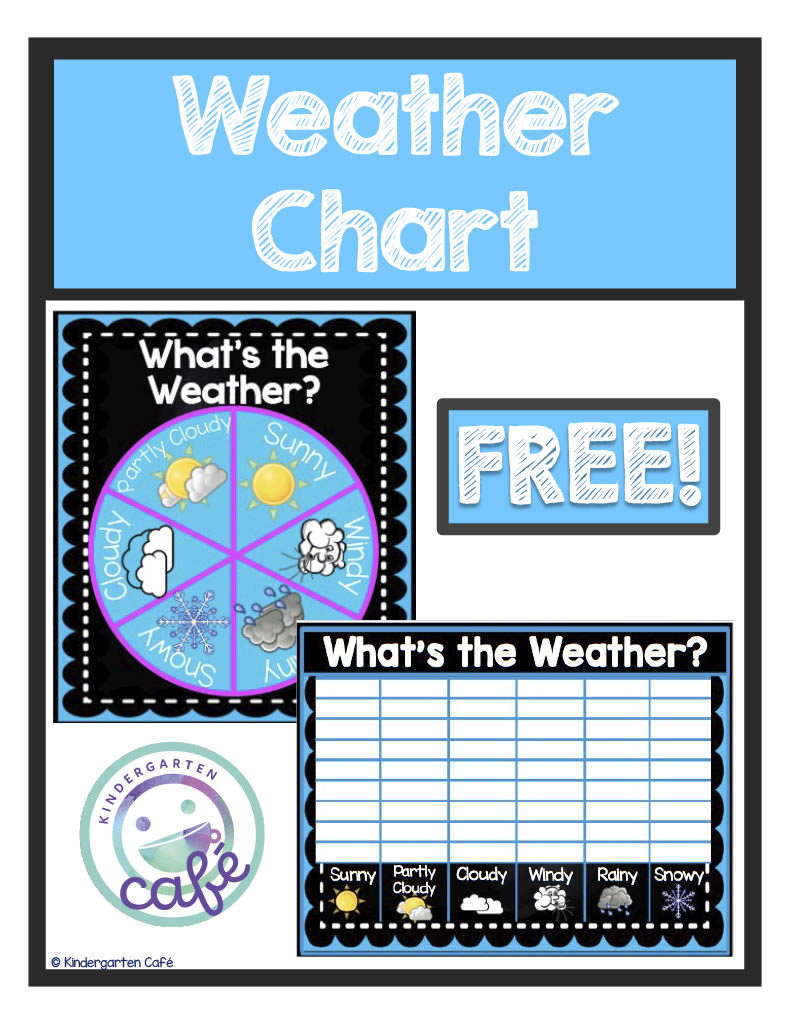
What's the Weather? Spinner and Chart is a teaching resource that focuses on weather concepts for elementary school students. This printable PDF includes two components - a circle spinner chart and a blank graphing chart with a chalkboard…

What's the Weather? Spinner and Chart in Neon Design This interactive and visually striking tool is available in a PDF format, consisting of three pages ready for printing. It's perfect for children ranging from Preschool to Grade 2.
 Free download
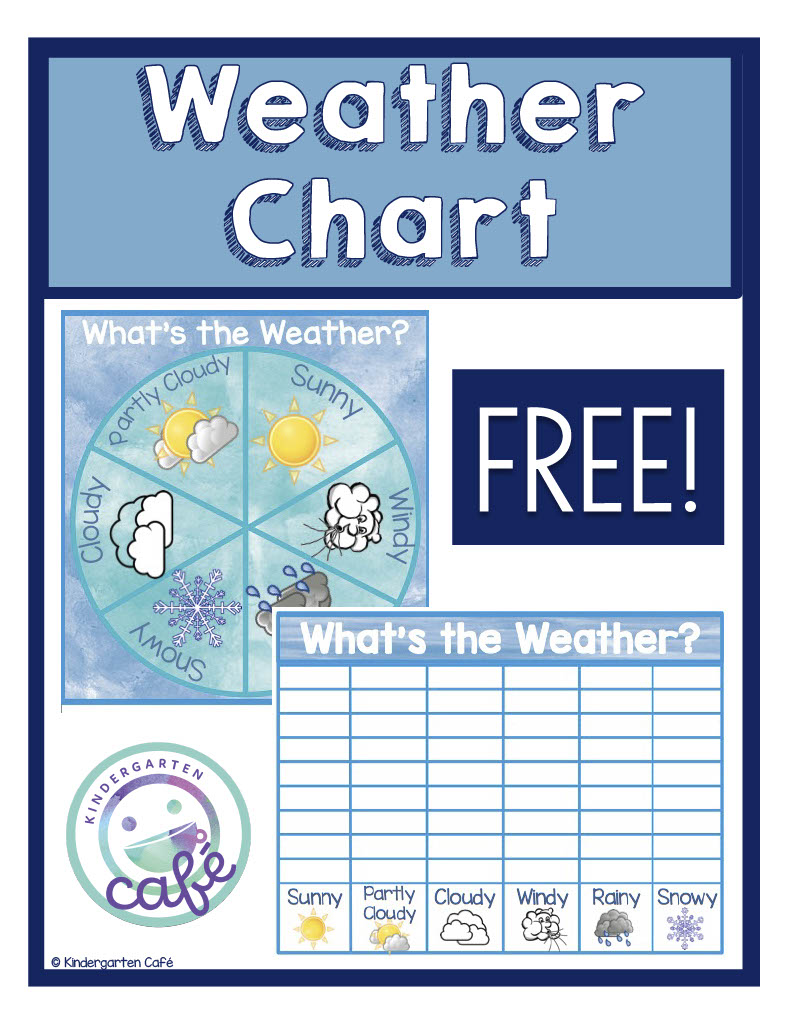
What's the Weather? Spinner and Chart This useful weather chart set can enhance elementary science lessons on meteorology. The set contains a spin wheel and graphing chart displaying common weather types like sunny, cloudy, rainy, snowy…