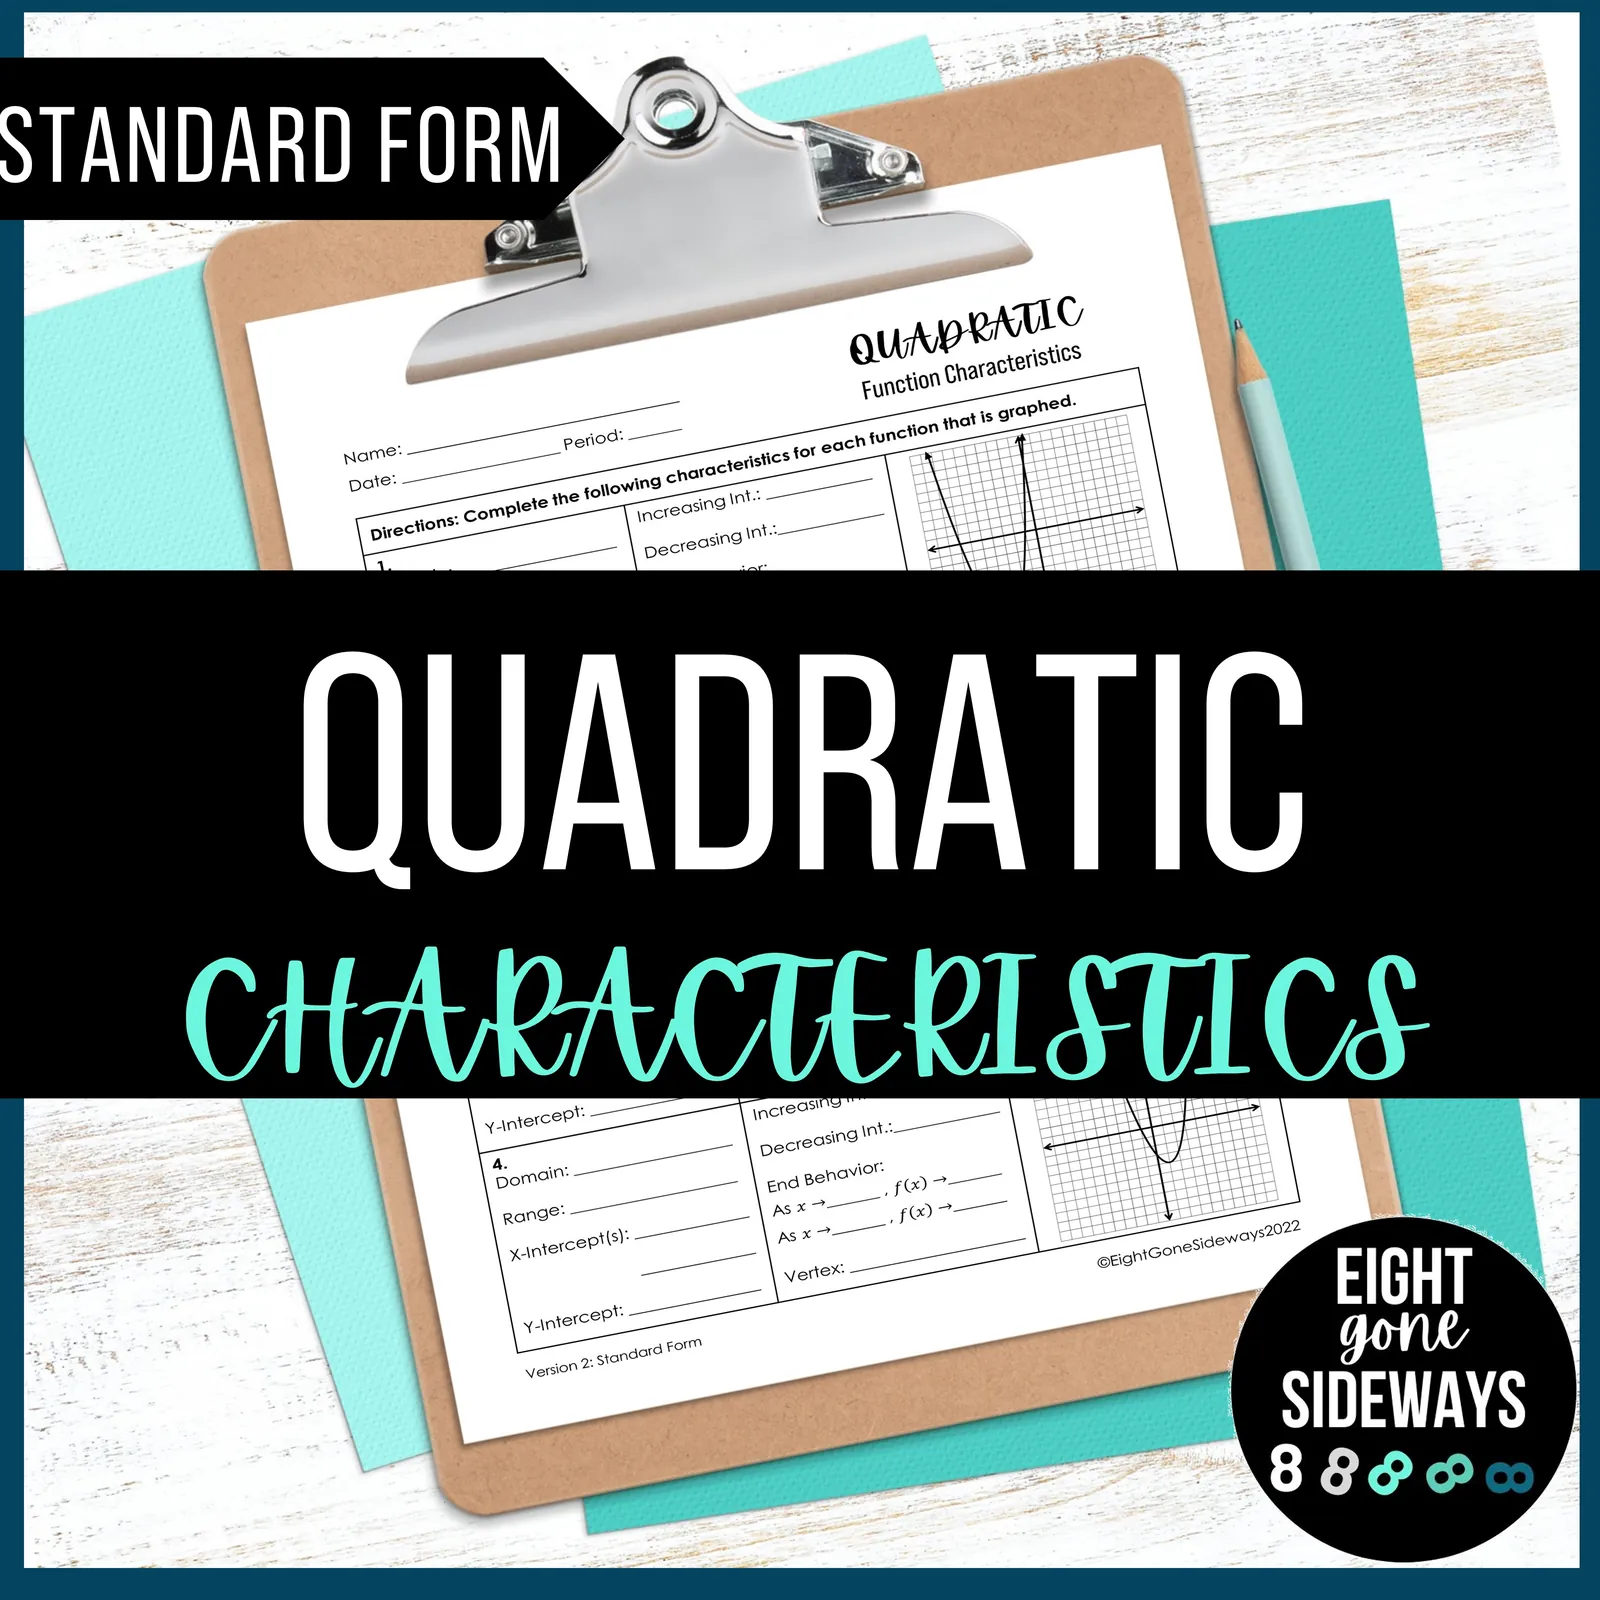
Graphing Quadratic Functions in Standard Form Worksheet
- Grades
- Grades 9–12, High School
- File type
- Preparation
- Print ready


- Subject
- Math, Algebra, Graphing
- Topic
- quadratic functions, standard form
- Resource types
- Worksheets & Printables, Worksheets
- Preparation
- Print ready
- Standards
- HSF-IF.B.4 HSF-IF.C.7 +1
About this resource
What's inside this resource
Related resources
More resources teachers may find useful
24 related resources were found using this product's title, contributor, categories and tags.

In the classroom
Teaching tips & learning objectives

Learning objectives
Determine the domain and range of a quadratic function from its graph or equation.
Identify the x- and y-intercepts and vertex of a quadratic function.
Describe a quadratic function's end behavior using limit-style notation.

Teaching tips
Assign the four graphed problems first as a warm-up before the four equation-based problems, since reading a graph is a more concrete entry point than algebraic analysis.
Use the worked answer key to model interval notation for domain, range, and increasing/decreasing intervals before students attempt the equation-based problems independently.
Note the 'Version 2: Standard Form' label if seeking companion versions in other forms (vertex, factored) from the same creator. A quadratic vertex form worksheet lets students compare what each form tells them about the graph.

Skills covered
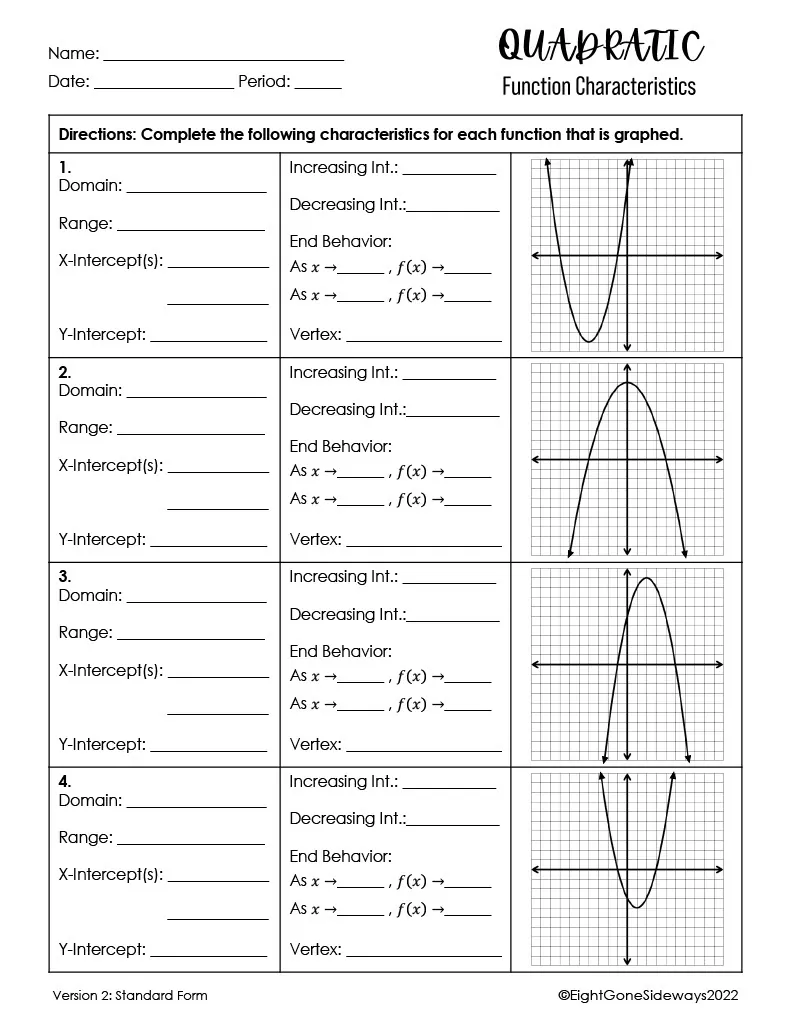
Quadratic graph analysis — students read domain, range, intercepts, and vertex directly from four graphed parabolas.
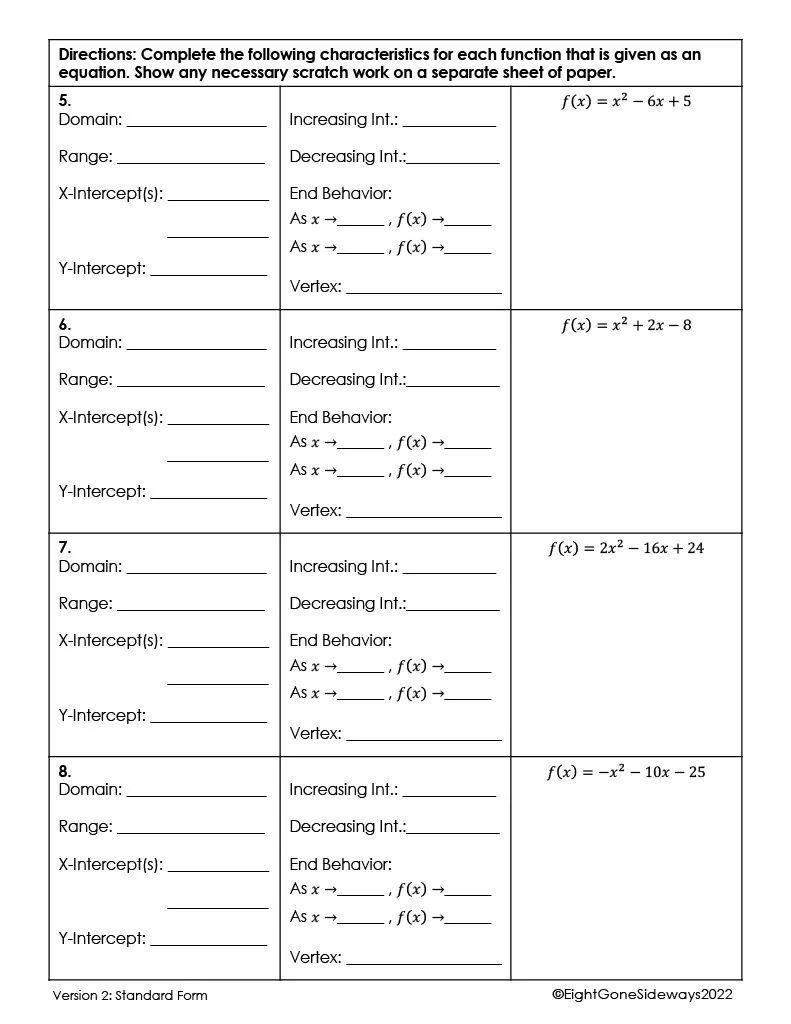
Standard-form equation analysis — students algebraically determine intercepts, vertex, and end behavior from four quadratic equations given in standard form.
Interval notation — students express domain, range, and increasing/decreasing intervals using interval notation.

No reviews yet
Downloaded this resource? Tell other teachers how it went.
Curriculum
Standards, concepts & topics
Standards
 Standards
- HSF-IF.B.4 — For a function that models a relationship between two quantities, interpret key features of graphs and tables in terms of the quantities, and sketch graphs showing key features given a verbal description of the relationship. Key features include: intercepts; intervals where the function is increasing, decreasing, positive, or negative; relative maximums and minimums; symmetries; end behavior; and periodicity. ★
- HSF-IF.C.7 — Graph functions expressed symbolically and show key features of the graph, by hand in simple cases and using technology for more complicated cases. a. Graph linear and quadratic functions and show intercepts, maxima, and minima. b. Graph square root, cube root, and piecewise-defined functions, including step functions and absolute value functions. c. Graph polynomial functions, identifying zeros when suitable factorizations are available, and showing end behavior. d. Graph rational functions, identifying zeros and asymptotes when suitable factorizations are available, and showing end behavior. e. Graph exponential and logarithmic functions, showing intercepts and end behavior, and trigonometric functions, showing period, midline, and amplitude.
- HSF-IF.A.1 — Understand that a function from one set (called the domain) to another set (called the range) assigns to each element of the domain exactly one element of the range. If f is a function and x is an element of its domain, then f(x) denotes the output of f corresponding to the input x. The graph of f is the graph of the equation y = f(x).
Core concepts
 Core concepts
quadratic functions
standard form
domain and range
vertex
end behavior
 Topics
Explore related searches
More to explore
You may also like