Graphing Proportional Relationships Worksheet (8.EE.B.5)
- Grades
- Grade 8
- Pages
- 18
- File type
- Answer key
- Included


- Subject
- Math, Graphing
- Topic
- Proportional relationships, Slope
- Resource types
- Worksheets
- Answer key
- Included
- Standards
- 8.EE.B.5
Product description
From the author
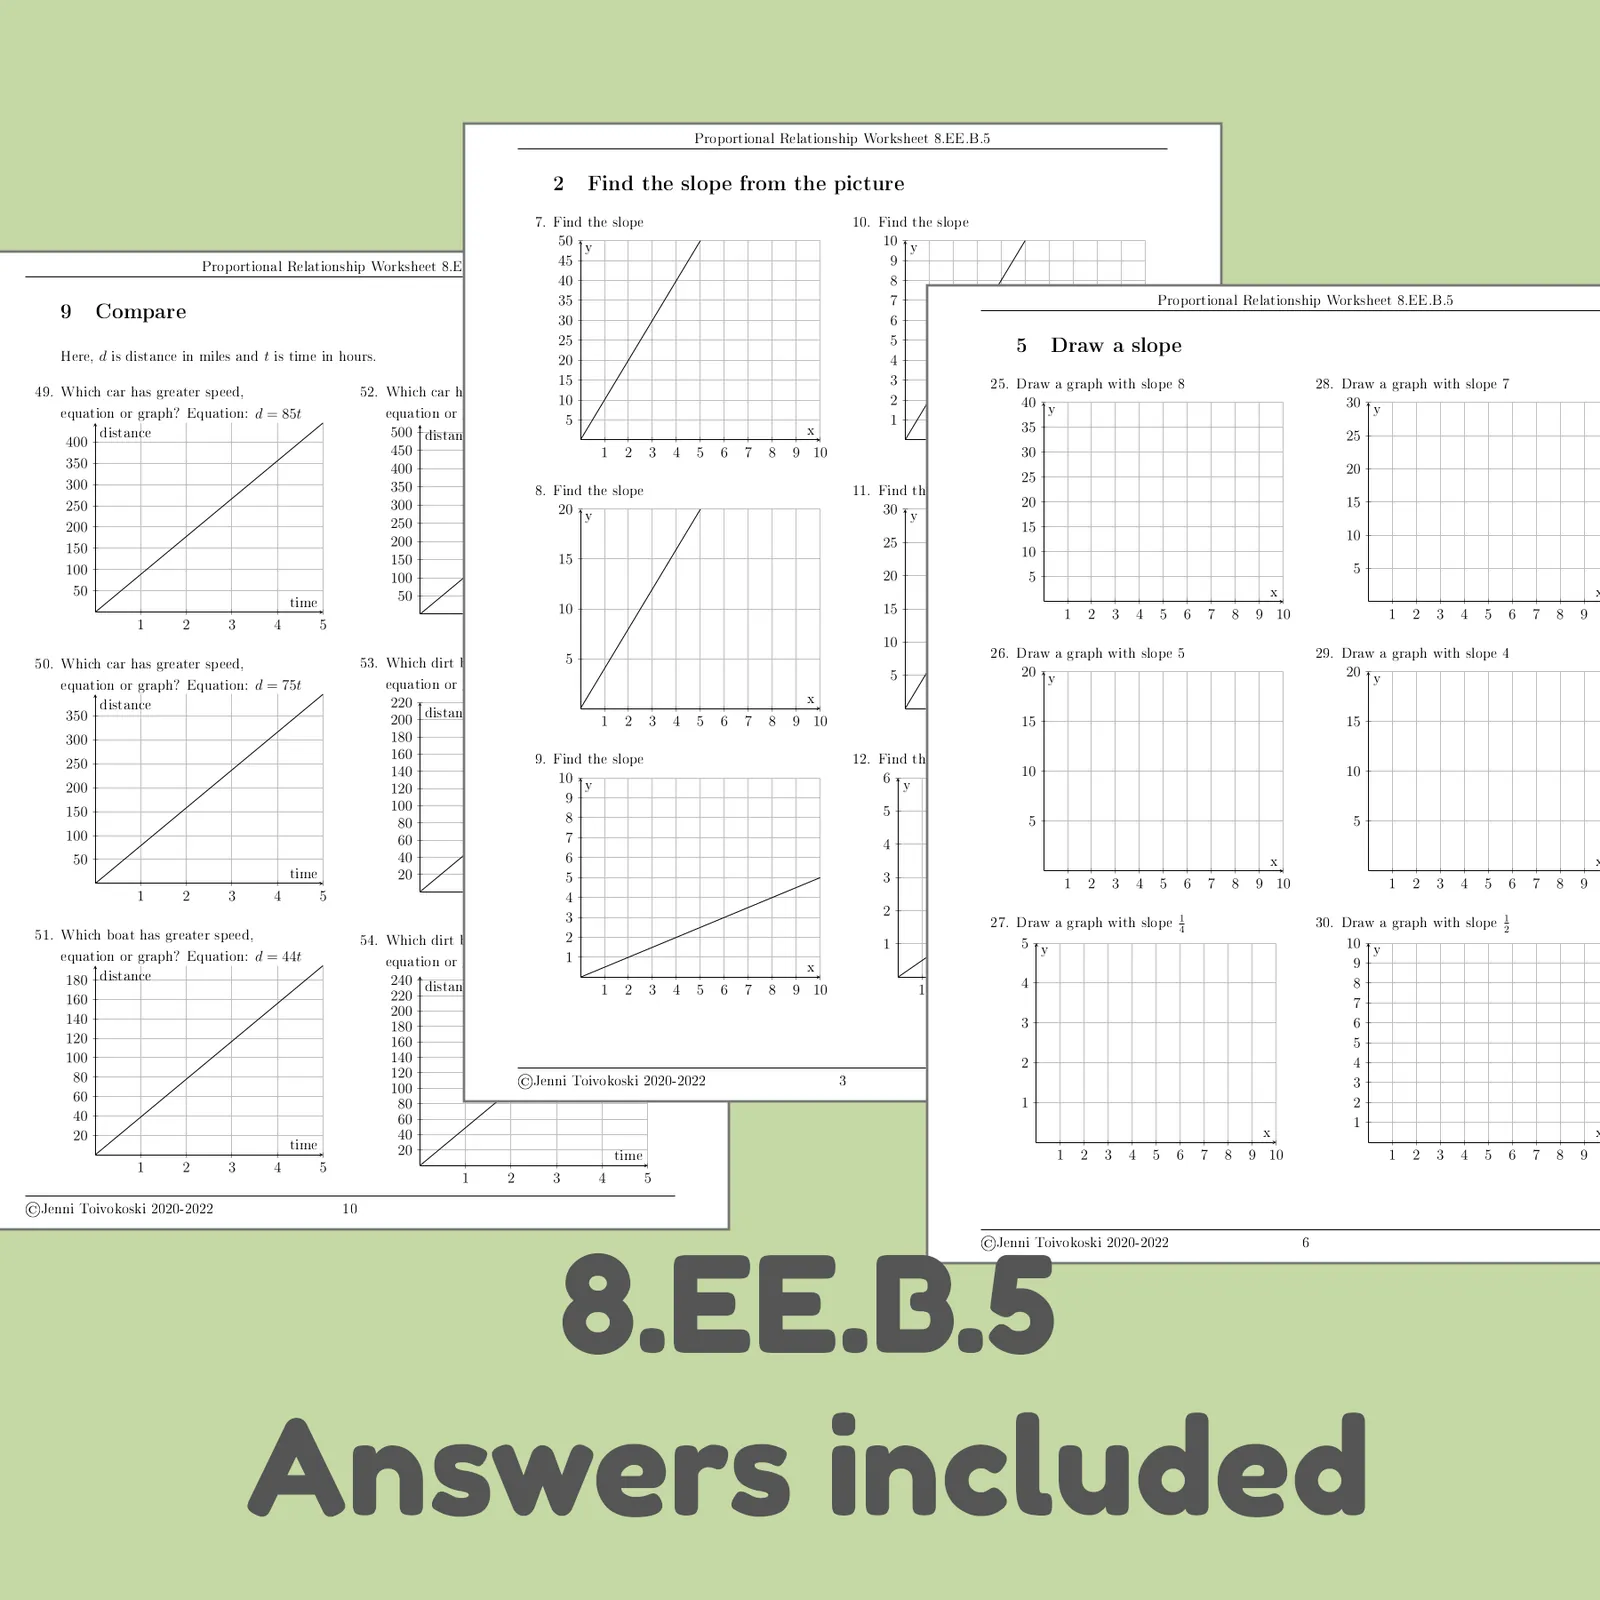
This proportional relationship worksheet has a lot of graphs with varying scales. Students need to find slopes from graphs and draw their own graphs based on a given slope. There are also comparing tasks where students compare slopes of graphs and equations.
Answers are included.
Related resources
More resources teachers may find useful
21 related resources were found using this product's title, contributor, categories and tags.

In the classroom
Teaching tips & learning objectives

Learning objectives
Find the slope of a line from its graph
Draw a graph representing a given slope
Determine whether a relationship between two quantities is proportional

Teaching tips
Graph axis scales vary between items (some count by 1s, others by 5s or 10s), so have students check the axis increments before reading or plotting a slope.

Skills covered
Finding slope from a graph
Comparing proportional relationships in equation and graph form
Identifying proportional relationships

No reviews yet
Downloaded this resource? Tell other teachers how it went.
Curriculum
Standards, concepts & topics
Standards
 Standards
- 8.EE.B.5
Core concepts
 Core concepts
Slope
Proportional relationships
Unit rate
Distance-time graphs
 Topics
Explore more
Categories this resource belongs to
Explore related searches
More to explore
You may also like