


Rate of Change Worksheet Covering Slope and Graphs
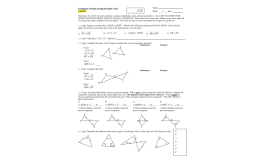
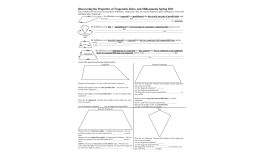
Real-world rate problems open a slope and rate of change study guide that moves on to graphing points, reading slope from graphs and writing line equations from a slope and a point.


- Grades
- Grades 7–9, Middle School, High School
- File type
- Microsoft Word


- Subject
- Math, Geometry
- Topic
- sope, rate
- Resource types
- Worksheets & Printables, Worksheets
About this resource
What's inside this resource
This study guide comes with an answer key!
Related resources
More resources teachers may find useful
24 related resources were found using this product's title, contributor, categories and tags.


In the classroom
Teaching tips & learning objectives

Learning objectives
- Calculate slope between two points and from graphs with different axis scales
- Write the equation of a line from a given slope and point
- Justify whether a statement about slope is true, using counterexamples

Teaching tips
- Slope-from-a-graph items use varying axis scales, so students need to read the scale labels rather than count grid squares.

Skills covered
- Finding rate of change — calculating rates from word problems
- Graphing from slope — plotting a line from a point and slope, then writing its equation
- Classifying lines — building t-charts to tell horizontal from vertical lines

No reviews yet
Downloaded this resource? Tell other teachers how it went.
Resource details
Concepts & topics
 Core concepts
 Topics
Explore more
Categories this resource belongs to
Explore related searches
More to explore
You may also like

Worksheets & Printables, Worksheets


Worksheets & Printables, Flashcards, Activities, Games, Worksheets


Lesson Plans, Teacher Tools