CHARACTER: The FIVE Elements of a Story Graphic Organizers
Provide a set of reusable graphic organizers focused on analyzing story characters, usable with any grade level or reading text.




665 resources
Explore sub-categories
8 sub-categories · 665 resources
Provide a set of reusable graphic organizers focused on analyzing story characters, usable with any grade level or reading text.

An anchor chart defines characters as 'the people or animals that the story is about' and then focuses on the main character, describing them as the most important character and the one central to the story's action. The chart is provided in two matching versions: a fully completed reference page for teacher display, and a second page with key words removed as blanks (e.g., 'the ______ or _______ that the story is about' and 'The MOST __________ CHARACTER'), letting a teacher use it as a fill-in-the-blank activity with students during a shared reading or mini-lesson. Once students can identify a story’s main character, the roll a story printable lets them apply that concept by rolling a character, setting, and story-line into an original story idea.
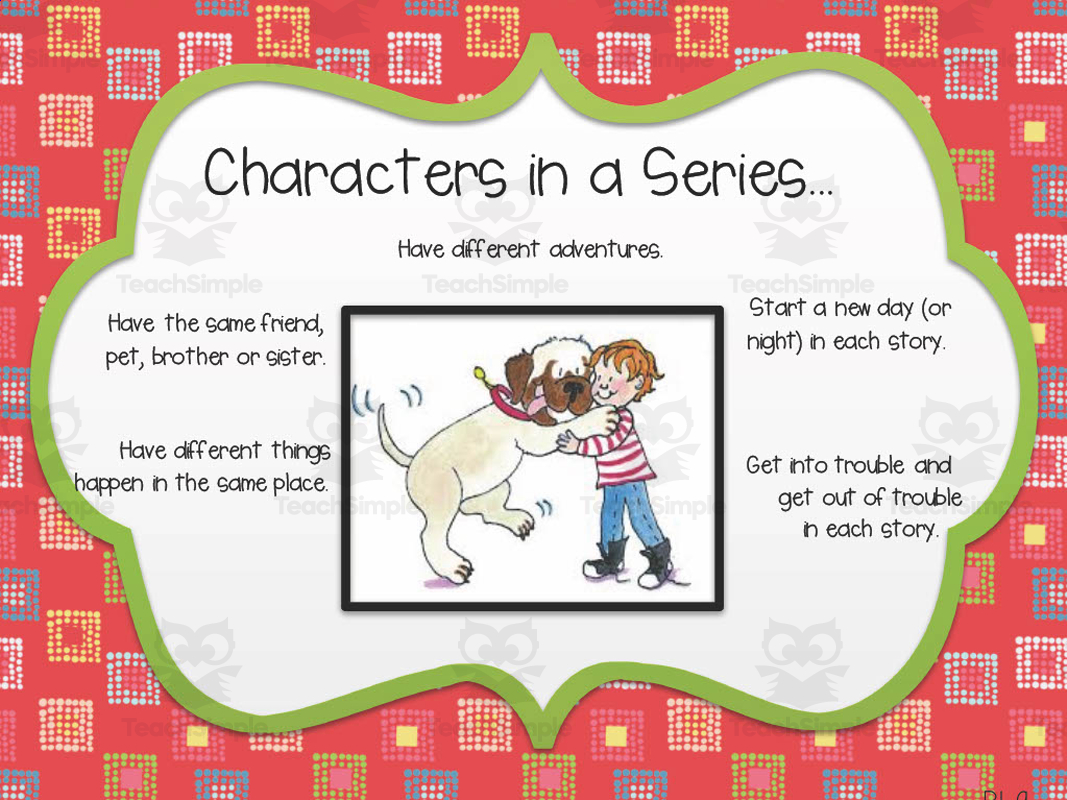
This resource is an anchor chart set for characters in a series. The first anchor chart is complete. The second anchor chart is a fill in the blank.
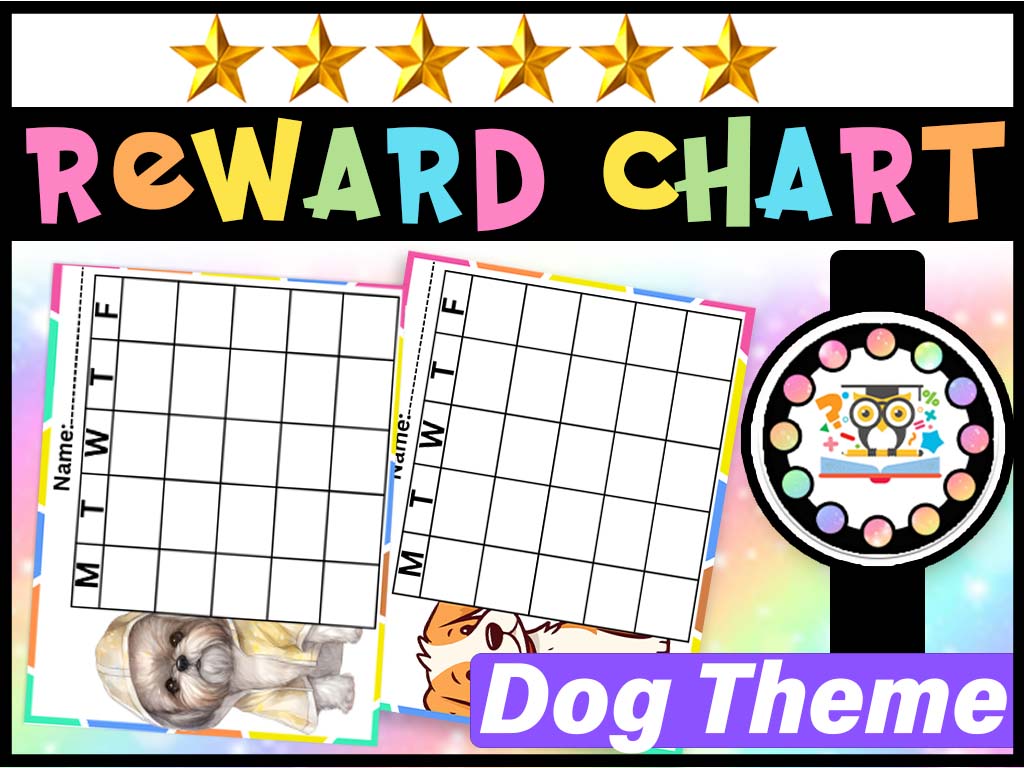
this file has a Chart Reward Incentives Dog Theme a picture you can use them in class and also send a copy home with a student, requiring additional practice i hope you find it useful each card has a fun.

One-page activity where students count and tally Christmas treats, then transfer the tallies to a graph.
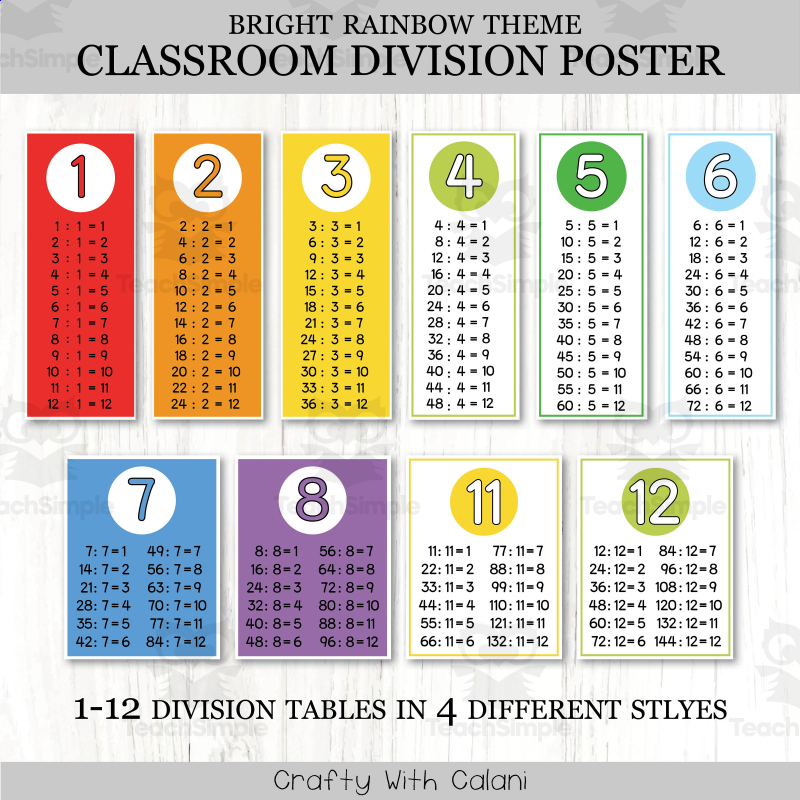
A set of classroom wall posters/charts displaying division facts from 1 to 12, used as visual reference decor to support memorization of division facts.
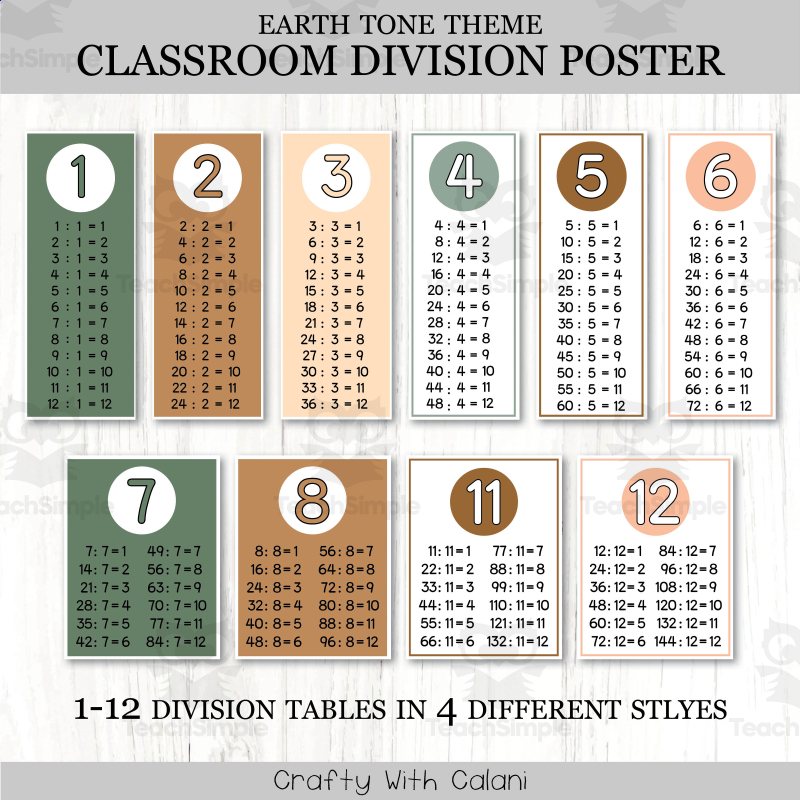
A set of classroom wall posters/charts displaying division facts from 1 to 12, used as visual reference decor to support memorization of division facts.

Classroom Voice Level Chart in Pastel Groovy Theme - 100% Editable An innovative product in the world of teaching resources, the Classroom Voice Level Chart is a boon to educators across all grade levels.

Classroom management tool: a voice-level clip chart showing a scale of acceptable classroom noise/talking levels.
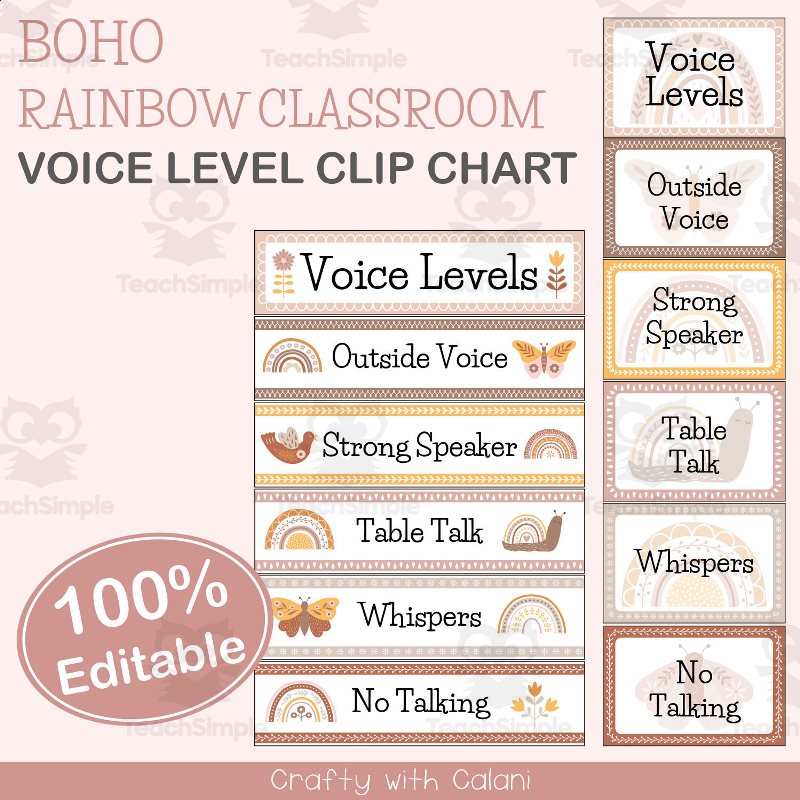
The Classroom Voice Level Clip Chart in Boho Rainbow Theme is an adaptable tool for educators seeking a visually captivating element that enhances class organization and management.
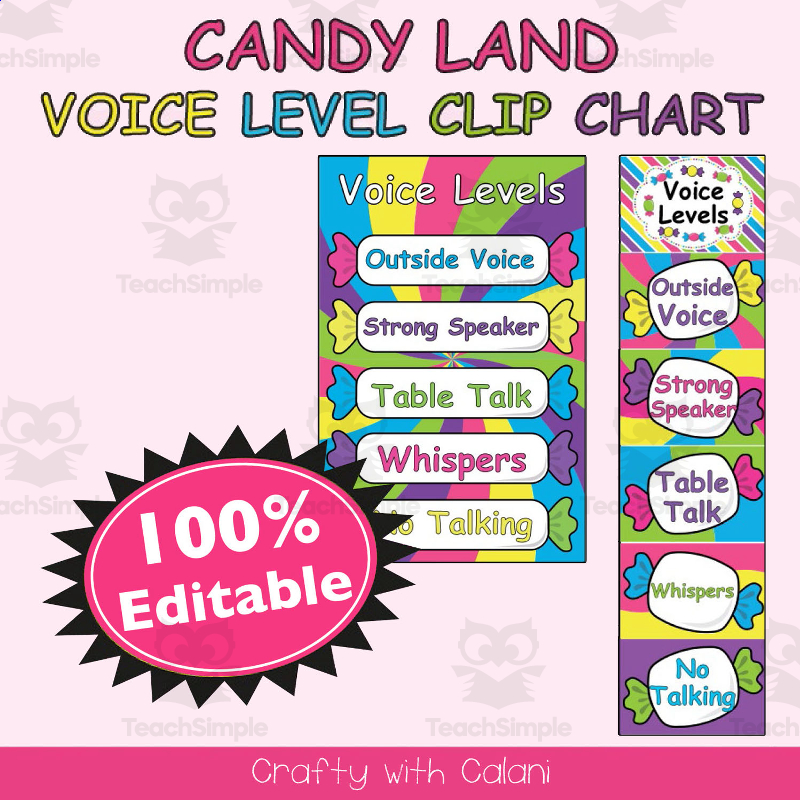
Classroom Voice Level Clip Chart in Candy Land Theme - 100% Editable This is an engaging resource aimed to foster an organized and vibrant learning environment.
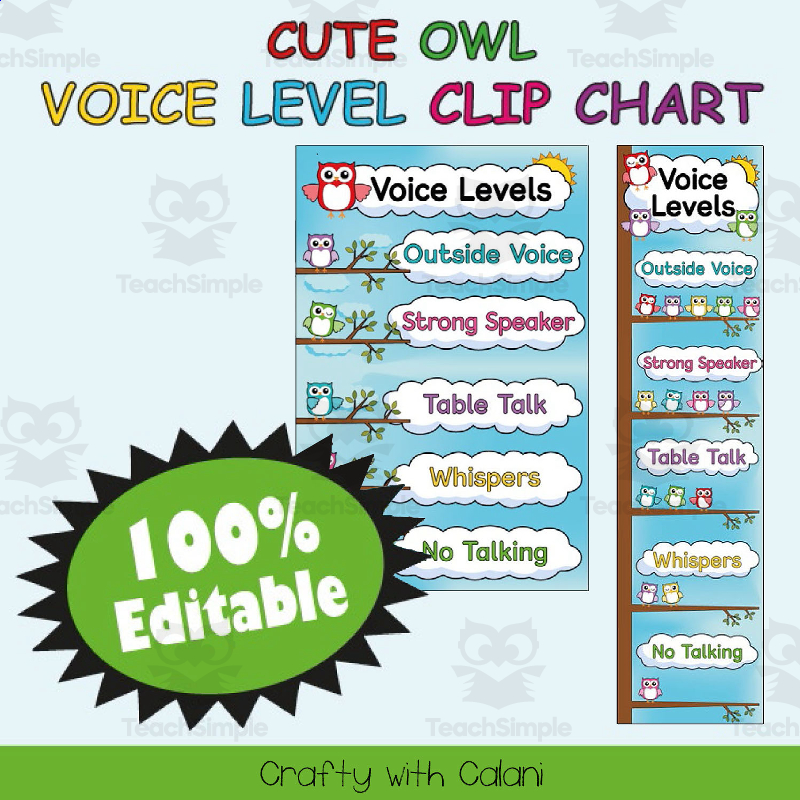
The Classroom Voice Level Clip Chart in Cute Owl Theme - 100% Editable This captivating teaching resource not only injects a dose of charm into classroom management, but also creates an ideal learning atmosphere.

This Compare Two Stories Worksheet can help your students read and compare two versions of the same story. This can be a great way for your students to improve their reading comprehension skills.
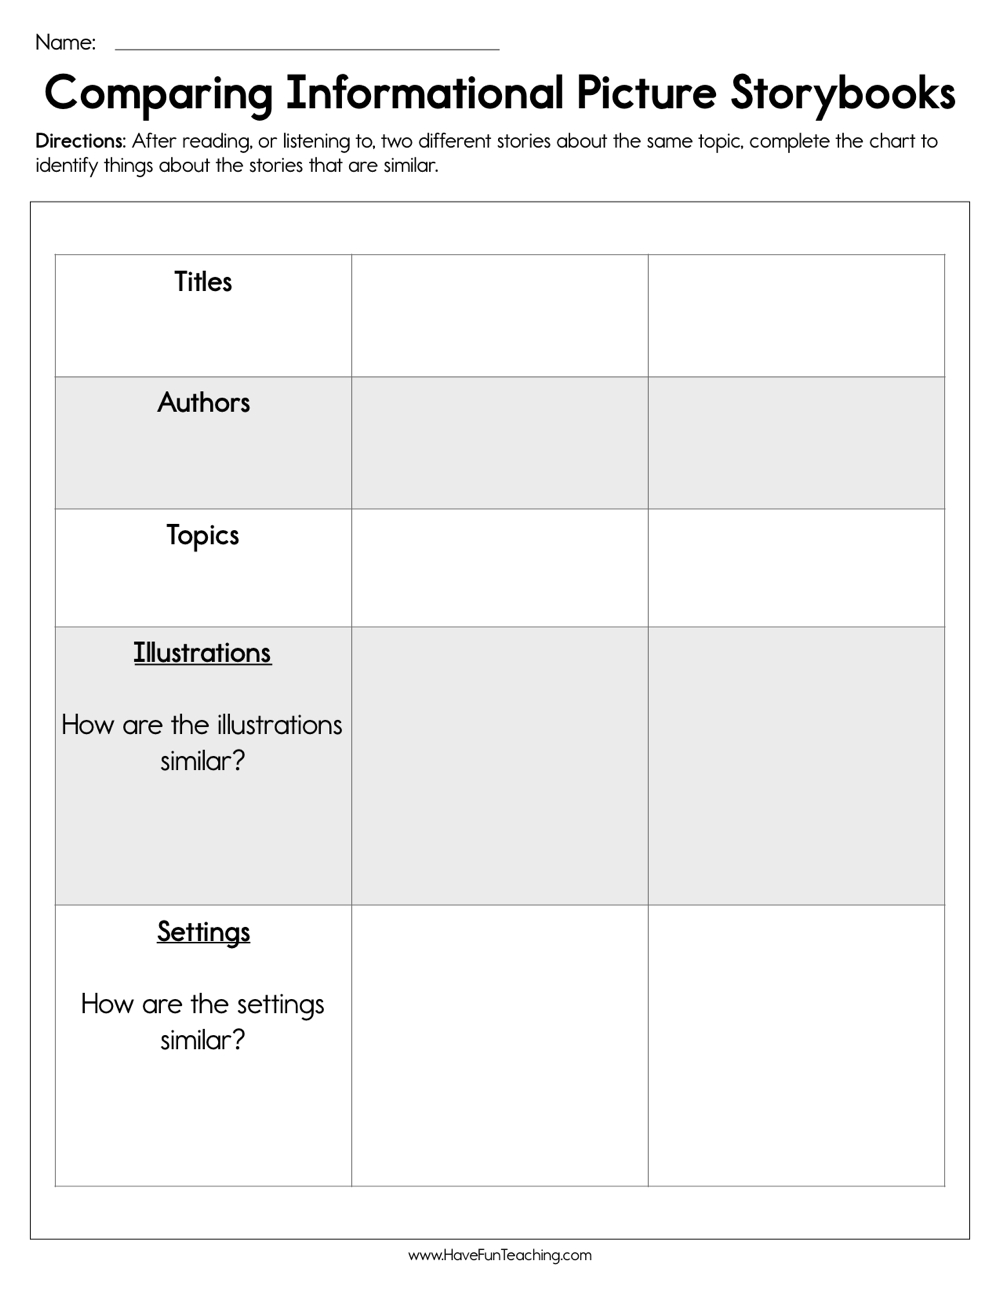
A worksheet/chart for comparing similarities between two informational picture storybooks on the same topic.
Ten blank graphic organizers each approach a story's conflict from a different angle. Conflict Dissection has students identify characters, setting, the problem and its solution in four quadrants; a Problems and Solutions Chart and a Cause-Effect-Consequences chart trace how a conflict's causes lead to its effects; an Internal or External Conflict chart and a four-column Conflict Type Chart classify the nature of the conflict, sorting it as character-versus-character, -nature, -self or -society; and a six-stage Conflict Timeline, an Opposing Forces Comparison, and a Conflict Map walk students through sequencing and mapping the conflict's events toward its resolution. A two-page instructional key at the front spells out exactly what to fill into each organizer's fields, and a Conflict Analysis page closes the set with a question-and-answer format leading to a written conflict statement. The templates are meant to be paired with a story or novel the class is reading, since none of the organizers are pre-filled with story content. This Conflict pack is one title in a Five Elements of a Story series that also covers Character, Setting, Plot, Theme and a Combined set.

A five-step statistics project has students design their own survey question with six to eight numerical answer choices, then survey at least twenty people and tally the responses. Students convert their collected data into both a dot plot and a histogram, labeling the x- and y-axis and adding a title to each chart. Blank axis templates for both charts are printed directly on the page, with a printed frequency scale from 1 to 11; larger frequencies may need an adapted scale or extra graph paper. A closing reflection section asks students to compare the two chart types and describe what surprised them in their own data, followed by a five-point self-assessment rubric covering four of the project's skills.
This resource is a Creepy Crawlies Interactive Graphing Set. You will receive: • Tips for the Teacher • Creepy Crawly Posters & Decorations • Kids’ Full moon Graphing Pics for Big Graph Chart • Creepy Crawly Tally & Bar Graphs, counting by…
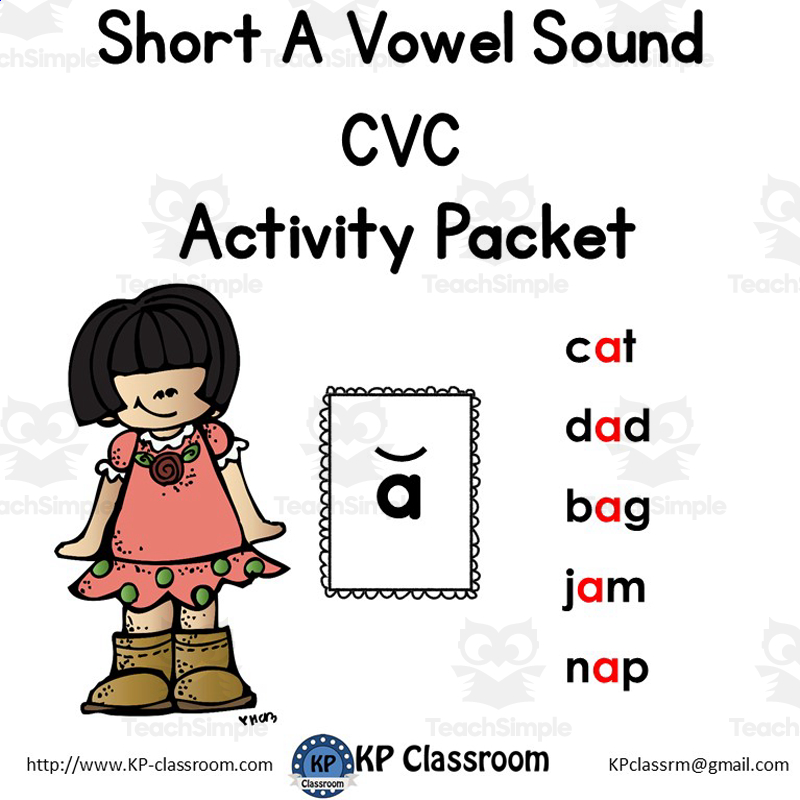
A phonics activity packet focused on short vowel 'a' CVC words, covering the phonics rule, word recognition, tracing, and picture matching.
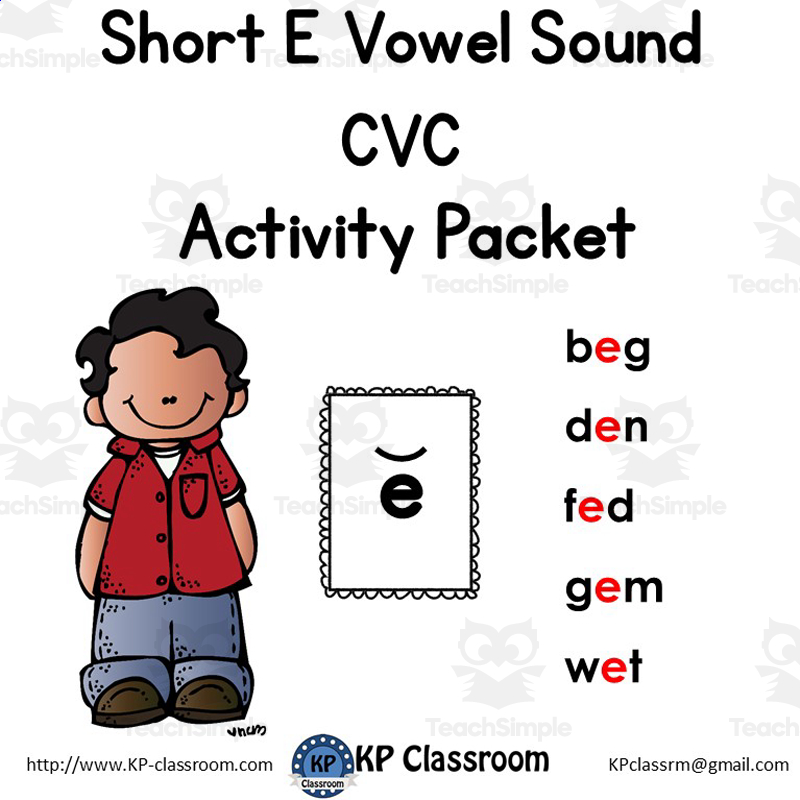
A phonics activity packet focused on short vowel 'e' CVC words, covering the phonics rule, word recognition, tracing, and picture matching.

Multi-activity phonics packet teaching recognition, reading, writing and spelling of short-i CVC words.
Data Analysis & Probability: Tally Charts - Learn the Skill on FLASH-MAC As an indispensable tool for educators, 'Data Analysis & Probability: Tally Charts - Learn the Skill' offered by FLASH-MAC simplifies teaching critical math…
FLASH-MAC: A Comprehensive Teaching Resource Data Analysis & Probability: Tally Charts - Pre- Assessment & Teach the Skill is a comprehensive teaching resource designed primarily for Grade 1 and Grade 2 students.

This resource is an editable data flip chart . It is all about goal setting and progress monitoring, so you can type in any benchmark assessments that your students take throughout the year.
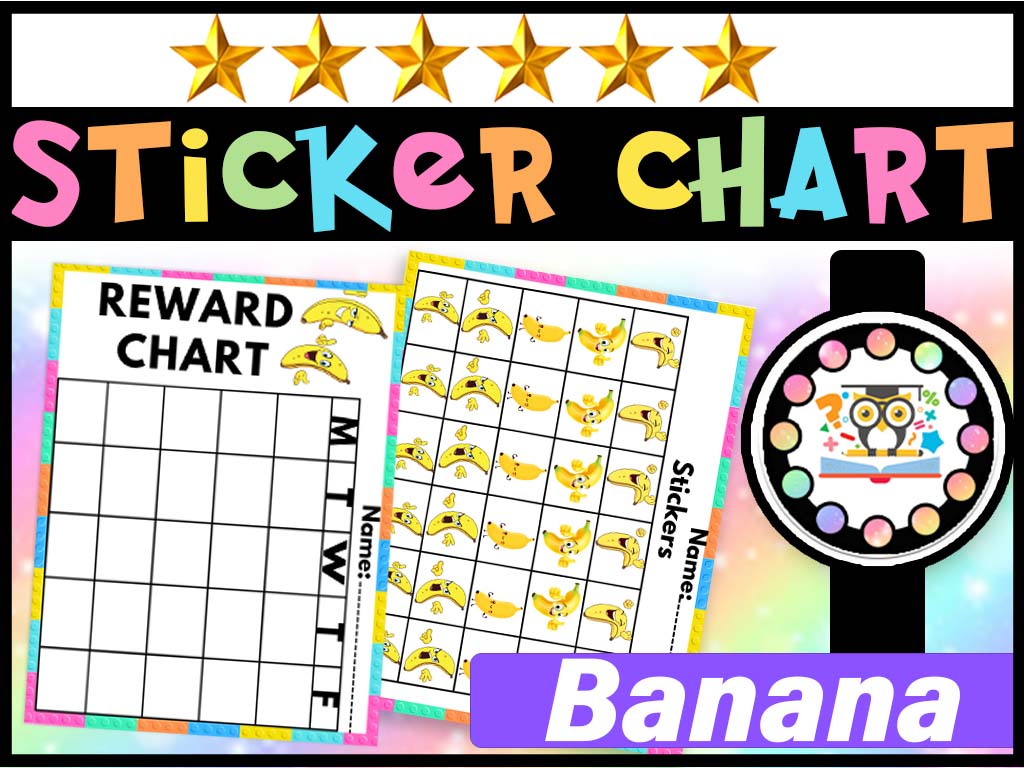
Write the student’s name on the weekday reward chart and agree on a specific goal. Print the matching banana sticker sheet and cut out markers to add to the grid. Briefly name the action that earned each marker so progress connects with a clear goal.