Like most elementary school math skills, area is one of those concepts that is taught more effectively using real-life context and tangible tools. Students must see and experience it to fully understand it. Using this method, they can connect their daily experience with area with what they learn in class.
Usually, students are first introduced to perimeter, an essential step required to help them understand area. Although they are traditionally taught separately, it is worthwhile introducing the concepts at the same time, even just as an introduction. You can then focus on perimeter, but at least the area seed has been planted. In addition, this will make them less likely to mix up the two, which happens surprisingly frequently.
An anchor chart is a visual representation that students turn to to reinforce their knowledge as they become more familiar with area. And the benefits are endless – they are way more than just a poster filling your wall space. Creating an anchor chart can accommodate different learning styles. All students will benefit if they’re involved in its creation – especially those who learn kinaesthetically. In addition, your students are way more likely to understand and refer to your chart if they are involved in its design. Anchor charts are a teacher’s greatest support when introducing area.
Table of Contents
- A good area anchor chart should contain the following elements.
- Different ways to teach area using anchor charts
- Resources from Teach Simple
- Other resources
A good area anchor chart should contain the following elements.
Make sure you are clear and straightforward
Regardless of what your anchor chart is covering, you should always provide clear, colorful visual examples. Many students rely on visual information to consolidate their understanding of maths concepts.
Context matters
Instead of just talking about area, use real-life examples to teach math concepts to children. For example, refer to sports fields, candy bars…whatever will grab their attention.
Hands-on first
In math, an anchor chart should reflect what is first demonstrated physically. In other words, students should interact with manipulatives before any information is put on your chart. Because they go hand in hand, you can return to activities you did when covering perimeter. For example, if you used Lego, let the students return to their boards and fill in the area to demonstrate the difference.
Get your students involved
Allow students to become involved in creating your anchor chart by leaving blank spaces for them to fill in with definitions, examples, and step-by-step instructions.
Decorate with purpose
There are many spaces in your classroom that can be turned into a ‘living anchor chart. For example, suppose you lined the door frame with perimeter flash cards. In that case, you can now fill the door area with flashcards and demonstrate the difference and the relationship between the two. If students see this display on their way out of class daily, they will grasp it more effectively.
Different ways to teach area using anchor charts
Display it in as many ways as possible.
Let the students become familiar with the various ways area can be defined or calculated.
Create images on grid paper
Students can use grid paper to create a character or to block-write their names. They can then count the blocks to understand the concept of square inches, feet, and miles.
Start simply, but leave room for expansion.
In the beginning, you should focus only on squares and rectangles. But you still need to ensure your students understand that area also applies to regular and irregular polygons etc.
Resources from Teach Simple
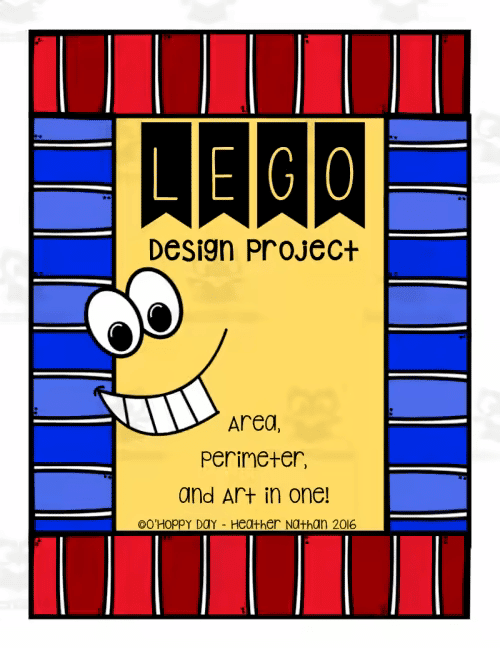
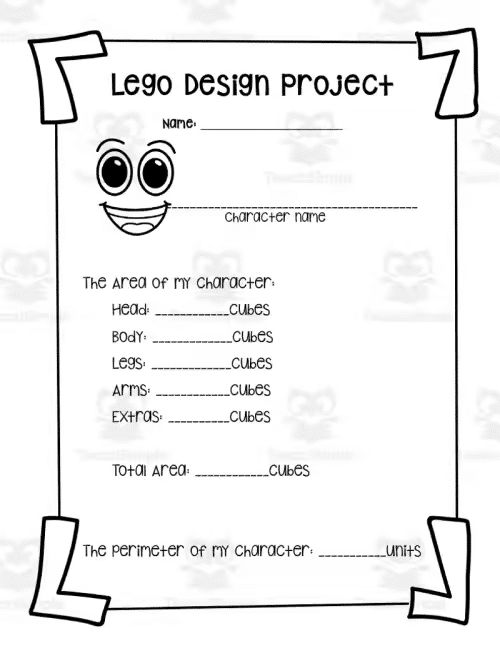
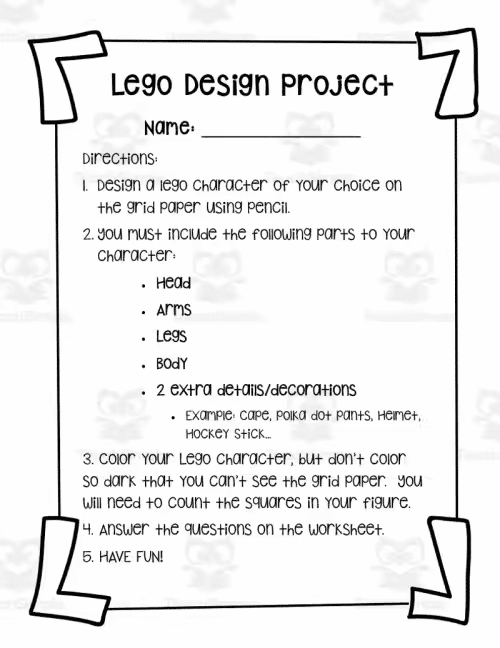
A LEGO Design project
Area lessons can be supported using this LEGO Design Project. Students design and color a LEGO character using grid paper. Then, after finishing the design and coloring process, they will use the grid paper to determine the area.
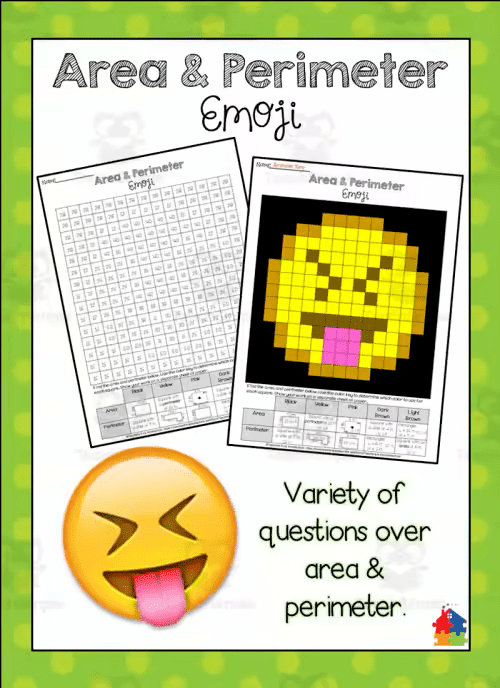
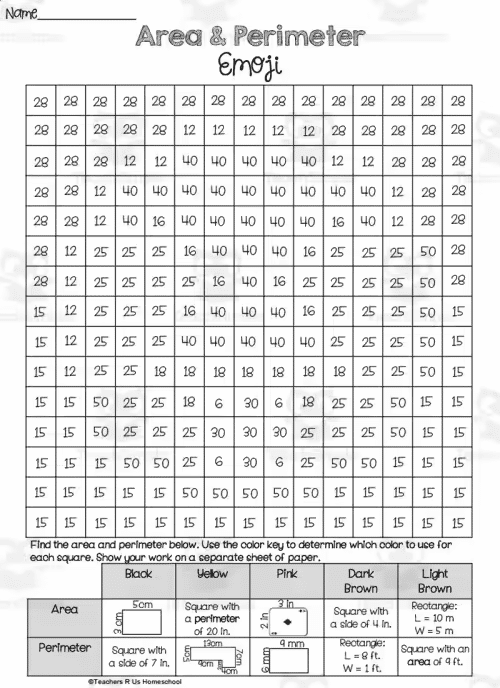
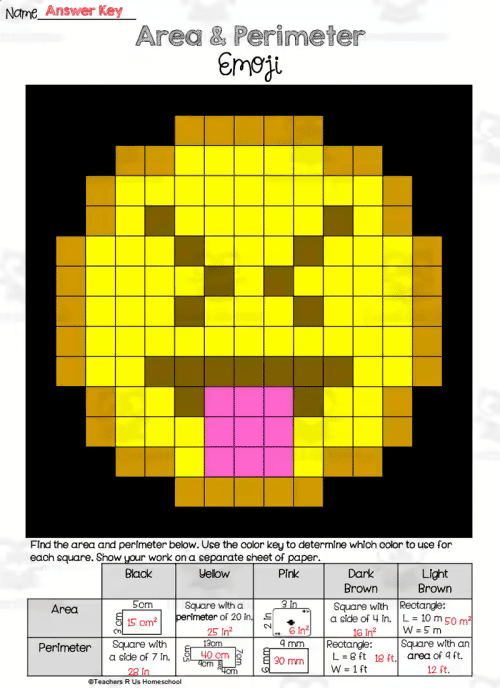
Emoji posters
This is another activity that is great for area and perimeter. Students create a great classroom display and practice concepts with this fun Emoji Worksheet.
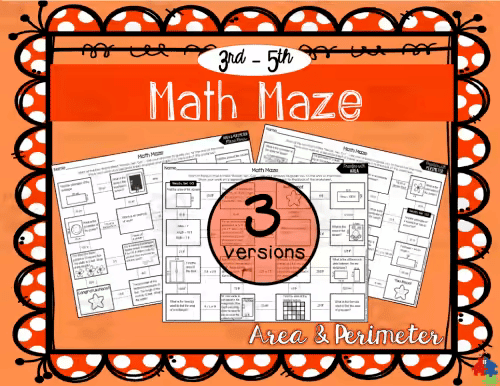
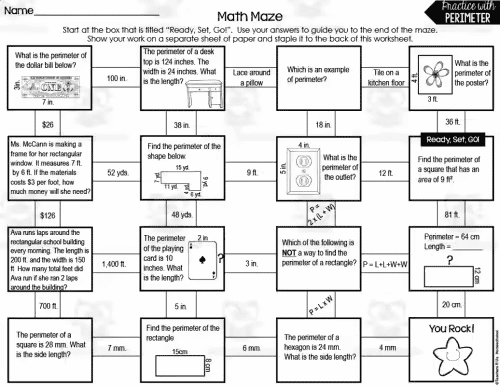
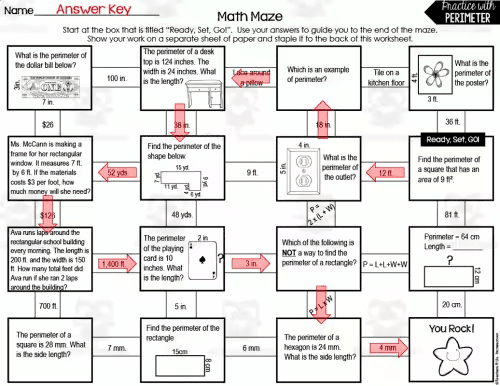
An area math maze (for perimeter, too)
Students start at “Ready, Set, Go!”. Then, they use their answers to guide them to the end of the maze and show their work on a separate sheet of paper.
Go Digital
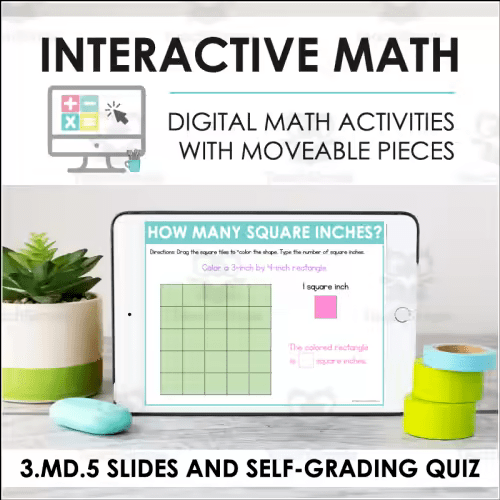
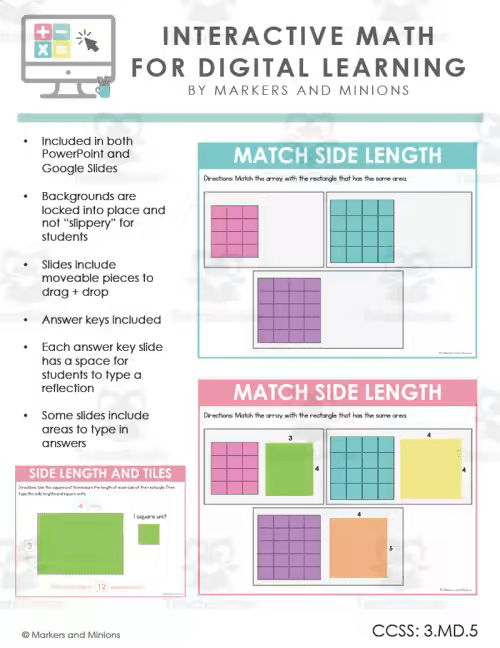
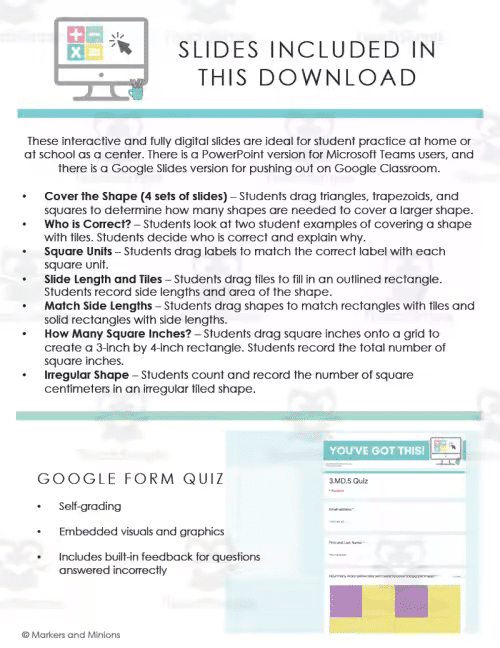
Even though we are now teaching in person again, many of us have embraced digital platforms for homework assignments and test practice. These games and software packages will save you a ton of time. Some will also support your area lessons when you move on.
Other resources
Area anchor charts
These simple charts are visual, teach terminology, and show formulas. Math is a lot of rote and memory, so these are excellent tools to help them along. The level obviously depends on the grade you are teaching, but there is something for everyone.
Learn about area creatively
These projects are perfect for middle school project-based learning. They can be used for assessments, practice, extension activities, bulletin board displays, or test preparation.
Learning with games
Children enjoy games, and if they practice math while at it, why not?
After shapes, area is one of the first geometry concepts students are introduced to. Lucky for you, there are tons of resources that will inspire your anchor charts or even provide them for you completely. In addition, there are activities to support your charts, help you build them, and check how well your students understand what’s going on. Some are freebies, and some will cost you a couple of dollars, but every single one will inspire you and make the art of teaching math way more fun and rewarding.

